
Spring is just about here and the kids can feel it!
When the kids feel it, so do the teachers.
I'm finally taking the time to get out a new blog post.
Today I'm sharing a few ideas I used with graphing.
I started by putting this question on the board.
Every student went up and wrote an answer.

Then I started to ask questions -
What was the most common food?
How many people wrote steak?
I asked the questions and called on students quickly.
I believe I even said, "Why don't you know the answer?"
and "Why is this so hard?"
We came to the conclusion that the info wasn't organized,
so it was difficult to answer the questions.
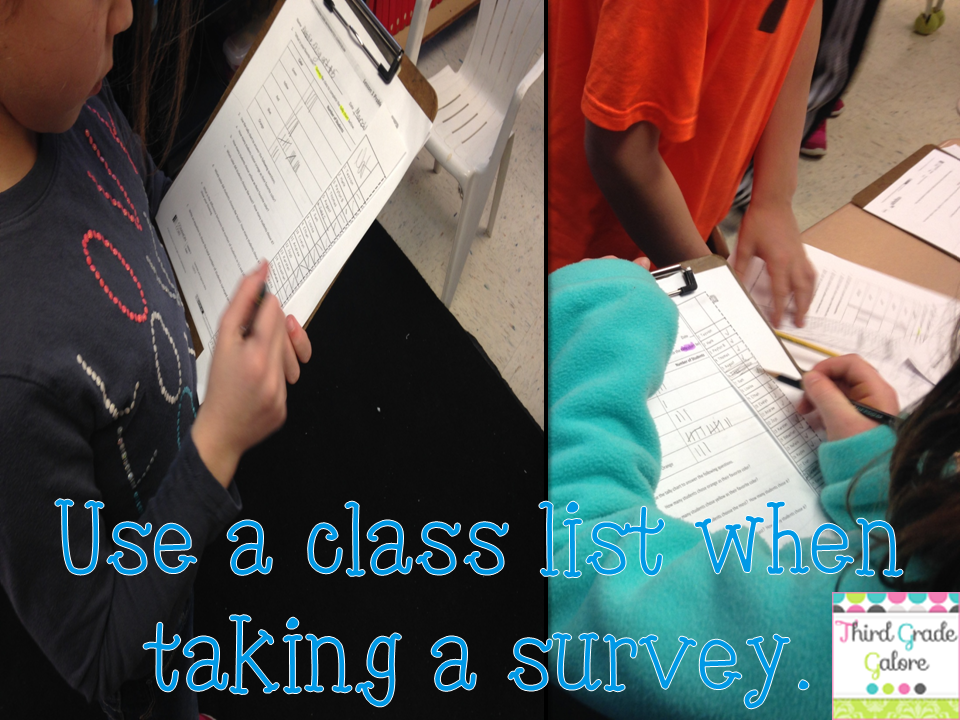
Next everyone was able to survey the class.
We all used the same question and choices since it was our first survey.
I gave each student a class list so they are able to survey all the students in class.
The next day the superintendent was coming to our school.
My principal needed classrooms to visit, so I volunteered.
The only reason I did was because I had a good math lesson planned.
I put this up on the board:

I told my kids I made a picture and I wanted them to see it.
Some thought it was the Chicago Skyline.
Others thought it was a graph of the survey we completed the day before.
They were wrong!
It was a graph showing what subjects the teachers at our school like to teach the most.
They were quite excited to find out that it was actual data
from an email survey I sent to our staff.
We quickly learned that it's important to have certain labels on a graph.

Our final step was to make a horizontal graph.
Can you see my error?

What are some fun activities you use with graphing?

No comments:
Post a Comment